
Report of cancer incidence and mortality in China, 2010
1 Introduction
1.1 Introduction of the cancer registration system
By definition, a cancer registry is an information system designed for the collection, storage, management, and analysis of data related to people with cancer. A registry usually covers a specific area. Cancer registries may provide accurate, up-to-date, population-based cancer data for incidence mortality and survival that are vital for decision making about cancer prevention and control. The data may also provide basic information for cancer research and cancer surveillance.
According to the cancer registry report released by National Central Cancer Registry (NCCR), the incidence and mortality of cancer have been rising gradually. New cancer cases and cancer deaths in 2009 were estimated at approximately 3 and 2 million, respectively (1). Since the national cancer registration program was established by the National Health and Family Planning Commission (NHFPC, previously the Ministry of Health), population-based cancer registration that collects information about cancer cases, cancer deaths and follow-up has spread to 31 provinces and municipalities throughout the country. Currently, the number of cancer registries is increasing, and the data quality is improving. The report has provided basic data that contribute to cancer control strategies, cancer research and clinical trials. At present, there are more than 250 cancer registries covering more than 200 million people. The cancer registration program is headed by the Bureau of Disease Prevention and Control, NHFPC and enforced by NCCR under the support of public health authorities in every province.
1.2 Development of cancer registries in China
1.2.1 National cancer registration program
The National Cancer Registry Program was established by the NHFPC in 2008 to support registry investigation, technical training, data collection and data management through central financing. In 2008, based on existing cancer registries, 52 counties or cities were selected to house new cancer registries that followed registry selection principles. These new registries covered all 31 provinces and municipalities with populations over 110 million. In fiscal year 2009, 54 cancer registries were established on the basis the previous year’s work, covering 10% of the national population. In fiscal years 2010 and 2011, another 46 registries came into operation; the total number of cancer registries increased to 195 and covered more than 13% of the national population. In 2012, the number of cancer registries expanded to 222, covering more than 200 million people.
1.2.2 Objective of cancer registration in China
General objective: to establish and perfect the cancer registration reporting system at a country level suitable to China’s socioeconomic status and actual situation. The cancer registry should reflect cancer epidemic trends and the different cancer incidences, mortalities and survivals in different areas and different regions, and it should provide sufficient information to meet the requirements of cancer prevention and control.
Stage of this objective:
- Systematic construction phase: By 2010, the number of cancer registries should reach 100. Every province should have at least two cancer registries: one in an urban area and the other in a rural area. These registries should cover all provinces and 10% of the national population after a comprehensive evaluation by the NCCR and the current state of the cancer registration system and the integration of existing resources via continuously enhancing the construction of the registry. This objective has been achieved.
- Standardized management phase: By 2015, the work flow of all cancer registries should be standardized and institutionalized. The data quality should meet the regulatory requirements established at the national level.
- Sustainable development phase: By 2020, through the increased number of cancer registries and improved data quality, the cancer registration data should be representative of the country and its regions.
1.2.3 Cancer incidence for 5 continents (CI5)
The International Agency for Research on Cancer/International Association of Cancer Registry (IARC/IACR) collects cancer incidence data from every country in the world and publishes the “Cancer Incidence for 5 Continents” report every 5 years. In 2010, the IACR called for the submission of incidence data for the years 2003 to 2007. The NCCR of China organized this submission, including data collection, data evaluation and quality control, to make sure the submitted data qualified. We submitted pooled data from 26 cancer registries for this report. After being evaluated by IACR, data from 12 registries on the Chinese mainland were accepted, which was the highest number ever accepted. The accepted registries were from Beijing, Shanghai, the Nangang District of Harbin City, Cixian of Hebei, Yangcheng of Shanxi, Haining, Jiaxing and Jiashan of Zhejiang, Qidong of Jiangsu, Yanting of Sichuan, Zhongshan of Guangdong and Wuhan of Hubei. This achievement indicates the gradual progress of cancer registration in China, which has been widely recognized by international colleagues and has entered a new stage.
1.2.4 Follow-up and survival analysis
Population-based cancer survival analysis can provide useful information that reflects the regional cancer burden and medical resources and evaluates cancer care. In the “National Program of Cancer Registry”, the importance of follow-up for cancer cases was emphasized.
To enhance population-based cancer follow-up and survival analysis, NCCR began collecting survival information in some of the registries that implemented follow-up. We also joined the international survival study (CONCORD II) and prepared to submit survival data. To date, a total of 14 registries have submitted follow-up data for cancer incidence cases from 2003 to 2005. The survival analysis is ongoing.
2 Data collection method and indices
2.1 Data collection
2.1.1 Data collection methods
Traditionally, reporting methods have been classified as active or passive. Active reporting involves registry personnel actually vesting the sources of data and abstracting the required information onto special forms or obtaining copies of necessary documents. Passive reporting relies on other health care workers to complete notification forms and forward them to the registry or to send copies of abstracts from which the necessary data can be obtained (Figure 1).

- Data collecting channels. Cancer registries should collect cancer statistics, including cancer incidence, cancer deaths, cancer survival, and population data from all kinds of channels. The cancer registries may collect cancer statistics from clinics and hospitals, health insurance databases, death surveillance databases, and cooperative health insurance databases in rural areas.
- Cancer case certification. The cancer registries are responsible for completing cancer case report forms using identification card numbers as personal identification codes. The cancer death records should also be matched with incidence case in the database. Missing incidence cases should be supplemented, and duplicated cases should be deleted.
- Follow-up practice. Through home visits, telephone calls, mail, and email, workers should contact the cancer cases and collect survival information.
2.1.2 Data collection indices
A core cancer registration service requires the collection of cancer incidence, mortality, and survival data, including data for cancers with ICD-10 codes of C00.0 to C97 (neoplasms of the central nervous systems and uncertain behaviors). Population coverage data should also be collected.
- Incidence: the personal information for incident cases, such as age, sex, date of birth, age at diagnosis, identification number, address, place of birth, race, marital status, and career, should be collected. Registries much archive the following detailed cancer data for each case: date of diagnosis; anatomical site and subsite; pathological, histological, and cytological results; diagnosis basis; and stage. The date of the reporting clinics of the diagnosis reporting bureau and reporting doctors should be collected. The follow-up information for registered cancer patients should also be recorded.
- Mortality: information about mortality often comes from population-based death databases that also report cancer cases that died from causes other than cancer. In addition to personal cancer incidence information, the mortality data should contain each case’s date of death, age at death, cause of death, place of death, and the diagnostic basis for the cause of death.
- Population data: the population data originate from statistics or public security census data departments. The detailed population data should cover the overall population, with age-specific data by 5-year age groups and sex-specific data.
2.2 Data quality control
2.2.1 Flow diagram of data quality control
After receiving cancer registration data, NCCR will first check the data’s completeness. After that, IARC/IACR check software will be used to determine whether all the variables are complete and valid (2,3). The internal consistency of the dataset will also be checked. NCCR will further publish a specific data evaluation report to each registry. The local registries will follow the evaluation report to check and revise the cancer datasets once again. Qualified cancer datasets will be pooled and analyzed for the annual national cancer report (Figure 2).

2.2.2 Quality control indices
The value of the cancer registry relies heavily on the underlying data quality and quality control procedures. The practical aspects for addressing data quality aim to provide qualified cancer registration data that is comparable, complete, valid, and timely (4,5).
- Comparability: comparability is the extent to which coding and classification at a registry, together with the requirements for recording and reporting specific data items, adhere to agreed international guidelines. When evaluating the comparability of registry data, the following topics demand particular attention: the classification and coding of neoplasms, the incidence distinction between primary cancer and the recurrence or metastasis of an existing cancer, and death certification criteria.
- Completeness: the completeness of cancer registry data refers to the extent to which all of the incident cancers occurring in the population are included in the registry database and is an extremely important attribute of a cancer registry. The methods that provide an indication of completeness include the following mortality and incidence ratios: the proportion of death certification only (DCO%), histological verification of the diagnosis, the number of sources/notifications per case, the stability of incidence rates over time, a comparison of incidence rates in different populations, the shape of age-specific curves, and the incidence rates of childhood cancers. Capture-recapture methods are also available to obtain a quantitative evaluation of the registry’s degree of completeness.
- Validity: validity is defined as the proportion of cases in a dataset with a given characteristic that truly have that attribute. Re-abstracting and recording permit comparisons with specified subsets of cases. The validity of the cancer registration information can be verified using diagnostic criteria (histological verification and DCO%), missing information analysis, and internal consistency methods.
- Timeliness: timeliness relates to the rapidity with which a registry can collect, process, and report reliable and complete cancer data. It indicates the time to availability as the interval between the date of diagnosis and the date that the case became available in the registry for further use. The cancer registries should collect and report cancer statistics in a timely manner. While there are no international guidelines for the timeliness of cancer registry data, NCCR requires the cancer registries of China to report cancer statistics within 30 months.
2.2.3 Classification of data quality
The detailed data inclusion criteria were based on the 2009 “Technical Protocols of Cancer Registration and Follow up” published by the Ministry of Health, the “Guideline for Chinese Cancer Registration” (6), and “Cancer Incidence for 5 Continents Volume IX” published by the IARC/IACR (7). The percentage of morphologically verified cases (MV%), DCO%, and the mortality to incidence ratio (M/I) were used to evaluate the completeness, validity, and reliability of cancer statistics. The quality of the cancer data was classified into three categories (Table 1). The data that were classified as Category A or B were qualified and deemed acceptable, whereas data classified into category D was rejected.

Full table
2.3 Classification and coding
2.3.1 Cancer classification
Based on the WHO ICD-10 cancer classification publications, cancers are classified into 25 categories with different anatomic sites. Neoplasms of the brain and central nervous system are also included in the ICD-10 cancer dictionary (Table 2).

Full table
2.3.2 Area classification
According to the GB2260-2009 standard, prefecture-level cities were classified as urban areas, whereas counties and county-level cities were classified as rural areas.
The classification of the east area, middle area, and west area is based on the National Statistics Bureau standard (Figure 3).

The east area consists of Beijing, Tianjin, Hebei, Liaoning, Shanghai, Jiangsu, Zhejiang, Fujian, Shandong, Guangdong, and Hainan.
The middle area consists of Heilongjiang, Jilin, Shanxi, Anhui, Jiangxi, Henan, Hubei, and Hunan.
The west area consists of Inner Mongolia, Guangxi, Chongqing, Sichuan, Guizhou, Yunnan, Tibet, Shanxi, Gansu, Qinghai, Ningxia, and Xinjiang.
2.4 Statistical indicators
2.4.1 Average annual population
The average annual population is the denominator of the incidence (mortality) rates. The exact method used to calculate this value is the average number of people at risk of incidence (death) each day of a specific year. Because this formula is highly complex, we often use the estimated calculation to quantify the population effectively. The formula is:
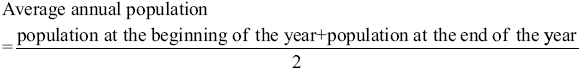
The midyear population is the population on July 1 00:00. If the population is relatively stable, the midyear population can be used to represent average annual population.
2.4.2 Sex- and age-specific population
The sex- and age-specific populations are the populations categorized according to sex and different age groups. These populations can be calculated by interpolation. Age-specific populations may be grouped into classes of up to five years, e.g., 0, 1-4, 5-9, 10-14…80-84, and 85+ years.
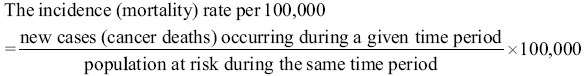
2.4.3 Incidence (mortality) rates
The incidence (mortality) rate measure the frequency with which an event, such as a new case of cancer (cancer death) occurs in a population over a period of time.
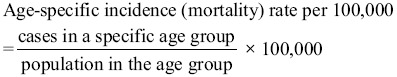
2.4.4 Sex and age-specific incidence (mortality) rates
Sex and age are important factors influencing cancer incidence and mortality. Sex-specific and age-specific rates are important statistical indicators.
2.4.5 Age-standardized rate or age-adjusted rate (ASR)
Standardization is necessary when comparing several populations with different age structures because age has such a powerful influence on cancer incidence and mortality. ASR is a summary measure of the rate that a population would have if it had a standard age structure.
In this report, the population standards we used are Segi’s population and the fifth Chinese national census of 2000 (Table 3).

Full table
Direct method for calculating incidence (mortality) rate:
- Calculating the rates for subjects from a study population in a specific age category.
- Calculating the weighted age-specific rates. The weights applied represent the relative age distribution of the standard population.
- Adding each weighted age-specific rate. The summary rates reflect the adjusted rates.

2.4.6 Proportions
Proportional distribution indicates the site-specific percentage level of incident cases and deaths compared with the total cases recorded. The formula is as follows:

2.4.7 Cumulative rate
A cumulative rate expresses the probability of cancer onset between birth and a specific age. The rate can be compared without age standardization because it is not affected by age structures. This rate is often expressed as the risk between 0 and 74 years old.

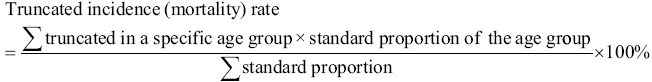
2.4.8 Truncated incidence (mortality) rate
The truncated rate is the calculation of rates over the truncated age of 35-64 years old using the WHO world standard population. The data are presented as truncated rates mainly because the accuracy of age-specific rates in the elderly may be much less certain and because cases in the younger age groups may be rare.
2.5 Data analysis
For the analyses, new cancer cases and deaths reported in registered areas in 2010 were pooled with demographic information. Data quality indicators, such as M/I, MV% and DCO% were analyzed. The cancer registry’s variables included the crude incidence rate, mortality, ASR China (based on the national population structure in 2000), ASR world (based on the world population structure in 2000), cumulative rate, and age-specific rate. The incidence and mortality were stratified by two levels: urban/rural, eastern/middle/western.
New cancer cases and cancer deaths were estimated based on the real national population in 2010, an application with widespread benefit. Based on the National Statistics Bureau China standard, we classified the population into the eastern area, the middle area, and the western area. We first calculated the cancer registration data for these three areas. Using the age-specific cancer incidence for the three different areas, the 2010 National Census Population data was multiplied by the age-specific cancer incidence (mortality) data, and the overall estimated new cancer cases (deaths) were summed up.
3 Results
3.1 Data in this cancer registry report
3.1.1 Data sources
A total of 219 cancer registries submitted 2010 cancer registration data to NCCR. Among them, 187 cancer registries were funded by the National Cancer Registration Follow-up Program, and 16 registries were funded by the Huai River Cancer Screening Program. Another 16 registries were funded by other programs. A total of 32 provinces (autonomous regions, municipalities, and Xinjiang production and construction corps) were covered by the registries, with a total of 92 prefecture-level cities and 127 counties (county-level cities). Jiangsu Province had the most cancer registries [27]. Shandong and Henan provided data from 16 registries. Beijing, Tianjin, and Guangzhou provided cancer data from metropolitan and rural areas separately; these data were classified as urban and rural areas correspondingly.
3.1.2 Coverage area
The 219 cancer registries were distributed across 31 provinces (autonomous regions and municipalities) consisting of 91 cities and 125 counties (Figure 3). In general, urban registries cover all central districts, and rural registries cover administrative areas. However, several urban registries only covered one district, such as the Nangang District and the Daoli District of Harbin City.
3.1.3 Population coverage
The total covered population of the 219 cancer registries in 2010 was 207,229,403, including 105,355,619 males and 101,873,784 females; this population accounted for 15.42% of the entire national population in 2010. The population coverage was 112,818,343 in urban areas (54.44%) and 94,411,060 in rural areas (45.56%), accounting for 15.02% of the overall national population in 2010.
3.1.4 Time scope
The data are all from individuals who were diagnosed with or died from cancer between January 1 and December 31, 2010 in registration areas that had reported population data in mid-2010.
3.2 Analysis of cancer registration data in 2010
3.2.1 Population coverage and the number of new cancer cases and cancer deaths
A total of 495,069 new cancer cases were reported in 2010. Among those cases, 59.35% were from urban areas, and 40.65% were from rural areas. There were 301,140 new cancer deaths in 2010. The urban cancer deaths accounted for 57.21% of overall cancer deaths, and rural cancer deaths accounted for 42.79%.
3.2.2 Trend analysis for the cancer incidence in China from 2003 to 2010
Overall, cancer incidence trends were relatively stable for most cancer registries that were established before 2008. However, for some new cancer registries established after 2008, including those from Linfen, Kailu, Dandong, Zidong, Yuzhou, and Wanzhou, the cancer incidence trends fluctuated sharply during these years.
3.3 Cancer registry selection and data quality evaluation
3.3.1 Cancer registry selection
Among the 219 cancer registries that provided cancer data to NCCR, a total of 145 cancer registries with qualified data were included in the final database for further analysis. Specifically, 52 submitted qualified cancer data (quality classification A). A total of 73 cancer registries submitted qualified cancer data (quality classification B). The data from 74 cancer registries that were classified as quality classification D were rejected. In particular, 20 cancer registries had only one or two indicators that did not reach the standard for quality classification B; those registries were included in the report. These 145 registries distributed throughout 28 provinces and municipalities, including 63 cities and 82 counties (Figure 3).
3.3.2 Data quality evaluation in the 2010 national cancer registries
Among the 145 cancer registries, the MV%, DCO%, and M/I were 67.11%, 2.99% and 0.61, respectively. In the urban cancer registries, the MV%, DCO% and M/I were 71.51%, 2.49% and 0.59, respectively. In the rural cancer registries, the MV%, DCO% and M/I were 60.65%, 3.72% and 0.64, respectively (Table 4).

Full table
3.3.3 Population coverage in selected cancer registries, 2010
The population covered by national cancer registration areas in 2010 was 158,403,248 (80,355,188 males and 78,048,060 females), which accounted for 11.82% of the national population in 2010, including 92,433,739 in urban areas (58.35%) and 65,969,509 in rural areas (41.65%). The population covered by cancer registration in the eastern areas was 106,326,379 (53,708,038 males and 52,618,341 females), which accounted for 67.12% of all cancer registration areas. The population covered in the middle and western areas in 2010 was 36,353,656 (18,618,501 males and 17,735,155 females) and 15,723,213 (8,028,649 males and 7,694,564 females), respectively, which accounted for 22.95% and 9.93% of all cancer registration areas, respectively.
3.4 Incidence and mortality for all cancer sites
3.4.1 Incidence for all cancer sites
The incidence rate, ASR for China, ASR worldwide and cumulative rate for both sexes and for males in eastern areas were lower than those in the middle and western areas, but for females, the rates were higher in the eastern areas than in the middle and western areas. The ASR for China, ASR worldwide and cumulative rate for females in the middle areas were the highest, and the rates in the western areas were the lowest (Table 5).

Full table
3.4.2 Age-specific incidence rate for all cancer sites
The cancer incidence was relatively low for the 0-24-year age group. It dramatically increased after 35 years, reached its peak in the 80-year-old group and then decreased slightly after 85 years. The model of age-specific incidence in urban areas was similar to that in rural areas. Incidence rates were higher in urban areas than in rural areas for males younger than 40 years and older than 60 years. Conversely, the rates were lower than in rural areas for males between 40 and 60 years. Incidence rates were higher in urban areas than in rural areas for females in all age groups (Table 6, Figure 4).

Full table

3.4.3 Mortality for all cancer sites
The mortality, age-standardized mortality and cumulative rate for all cancer sites in the western areas were higher than those in the eastern and middle areas for both males and females. The mortality, age-standardized mortality and cumulative rate for all cancer sites in the middle and eastern areas were basically same (Table 7).

Full table
3.4.4 Age-specific mortality for all cancer sites
The age-specific mortality increased with age and was relatively low in the population younger than 30 years old. There was a dramatic increase in mortality in the 35-year age group, and it peaked at the ages of 85+ and 80– years old in urban and rural areas, respectively. The change model for age-specific mortality in the urban and rural areas was basically same. In all age groups between 15 and 70 years old, the mortalities in rural areas were higher than those in urban areas; in other age groups, the mortality rates were lower (Table 8, Figure 5).

Full table

3.5 The 10 most common cancers in China
3.5.1 Incidence of the 10 most common cancers
Lung cancer was the most common cancer, followed by cancers of the breast, stomach, liver and esophagus. In males, lung cancer was the most common cancer, followed by cancers of the stomach, liver, esophagus and colorectum. In females, breast cancer was the most common cancer, followed by cancers of the lung, colorectum, stomach and liver (Table 9, Figure 6).

Full table

3.5.2 The 10 leading causes of cancer death
Lung cancer was the leading cause of cancer death, followed by cancers of the liver, stomach, esophagus and colorectum. In males, lung cancer was the leading cause of cancer death, followed by cancers of the liver, stomach, esophagus and colorectum. In females, the five leading causes of cancer deaths were lung cancer, stomach cancer, liver cancer, esophageal cancer and breast cancer (Table 10, Figure 7).

Full table

3.5.3 Incidence of the 10 most common cancers in urban areas
In urban areas, lung cancer was the most common cancer, followed by cancers of the breast, stomach, colorectum and liver. In males, lung cancer was the most common cancer, followed by stomach cancer, liver cancer, colorectal cancer and esophageal cancer. In females, breast cancer was the most common cancer, followed by cancers of the lung, colorectum, stomach and liver (Table 11, Figure 8).

Full table

3.5.4 The 10 leading causes of cancer death in urban areas
In urban areas, lung cancer was the leading cause of cancer death, followed by cancers of the liver, stomach, colorectum and esophagus. In males, lung cancer was the leading cause of cancer death, followed by liver cancer, stomach cancer, esophageal cancer and colorectal cancer. In females, lung cancer was the leading cause of cancer death, followed by stomach cancer, liver cancer, colorectal cancer and breast cancer (Table 12, Figure 9).

Full table

3.5.5 Incidence of the 10 most common cancers in rural areas
In rural areas, lung cancer was the most common cancer, followed by cancers of the stomach, liver, esophagus and breast. In males, lung cancer was the most common cancer, followed by stomach cancer, liver cancer, esophageal cancer and colorectal cancer. In females, breast cancer was the most common cancer, followed by lung cancer, stomach cancer, esophageal cancer and liver cancer (Table 13, Figure 10).

Full table

3.5.6 The 10 leading causes of cancer death in rural areas
In rural areas, lung cancer was the leading cause of cancer death, followed by liver cancer, stomach cancer, esophageal cancer and colorectal cancer for the whole population and for males. In females, lung cancer was the leading cause of cancer death, followed by stomach cancer, liver cancer, esophageal cancer and breast cancer (Table 14, Figure 11).

Full table

4 Discussion
Since the launch of cancer registration project in 2008, the populations covered by cancer registration have dramatically increased in China on an annual basis, with the nationwide coverage reaching 15% in 2010 (1). The implementation of the NCCR project throughout the country has increased the number of tumor registries and the quality of data. In 2010, the data for the annual report were collected in an even more rigorous manner. The NCCR carefully reviewed all the data received and finally included the data from 145 registries in the 2013 annual report to analyze the morbidities and mortalities of cancers in China in 2010. Data were stratified according to areas (the eastern, middle, and western areas) to increase the applicability of the annual report. Also, the estimates for the new cases and deaths were added to reflect the tumor burdens nationwide and in different areas in a more direct way. As shown in the report, the incidences and mortalities of malignant tumors remained unchanged across China in 2010 when compared with the data in 2009 (8). Although the coverage of tumor registration still remarkably differs among different areas, the data met the features of tumor development and its associated deaths, indicating that the tumor registration data has become reliable. Also, the coverage of certain populations can reflect the overall tumor burden in China, and therefore is nationally representative. However, its representativeness in different populations, areas, and regions after stratification requires further evaluation. The tumor burdens dramatically differ in urban and rural areas. The incidences of tumors are significantly higher in urban areas than in rural areas, while the case-fatality rate is dramatically higher in rural areas. In addition, the proportions of different tumors are also different. In the rural areas, the inadequate medical resources, low diagnosis/treatment capabilities, and low health awareness result in delayed identification of tumors and poor prognosis. Upper gastrointestinal tumors remain common among rural residents and are the leading causes of cancer deaths; meanwhile, the incidences of lung cancer, breast cancer, and colorectal cancer have increased annually. The cancer spectrum in urban areas is similar to those in developed countries, and the incidences of lung cancer, breast cancer, and colorectal cancer also have been rising. Notably, there is an obvious upward trend in thyroid cancer among women. Thus, the prevention and control of tumors in China should be tailored in different areas. Currently, the increasing burdens of chronic diseases, in particular tumors and other environment-related health problems, have become a nationwide concern. The NHFPC of China has developed the Chronic Diseases Prevention and Control Program for the Twelfth Five-Year Plan, focusing on information monitoring, health education, and early detection/treatment, with an attempt to hold back the rising burdens of chronic diseases. As a basis for tumor prevention and control, the dynamic monitoring of tumor incidences and mortalities will be beneficial for the implementation, adjustment, and evaluation of the program. The NCCR will seize this opportunity and gradually enlarge the populations covered by the tumor registries, improve the data quality, and strengthen the analysis and utilization of registration data, so as to contribute more in the fighting against tumors.
Acknowledgements
The authors would like to express its gratitude to all cancer registry staff members who have contributed to this report, especially by auditing data reduction supplements and managing the cancer registration database. Sincere thanks go to all members of the contributing cancer registries for their great efforts. Additionally, we gratefully acknowledge the editing support provided by the China Cancer Board. The National Cancer Registration Program was supported by special funds for medical and healthcare reform.
Disclosure: The authors declare no conflict of interest.
References
- He J, Chen WQ. Chinese Cancer Registry Annual Report. Beijing: Military Medical Science Press, 2012.
- Felay J, Burkhard C, Whelan S, et al. Check and Conversion Programs for Cancer Registries. IARC Technical Report No.42. Lyon: IARC 2005.
- Felay J. The IARCcrgTools program [EB/OL]. http: //www.iacr.com.fr/iarccrgtools.htm. Lyon: IARC 2006.
- Bray F, Parkin DM. Evaluation of data quality in the cancer registry: principles and methods. Part I: comparability, validity and timeliness. Eur J Cancer 2009;45:747-55. [PubMed]
- Parkin DM, Chen VW, Ferlay J, et al. Comparability and Quality Control in Cancer Registration. IARC Technical Report No.19. Lyon: IARC 1994.
- National Central Cancer Registry. Guideline of Chinese Cancer Registration. Beijing: Peking Union Medical College Press, 2004;48-50.
- Curado MP, Shin HR, Storm H, et al. Cancer Incidence in Five Continents, Vol. IX. Lyon: IARC Scientific Publications 2008.
- Chen W, Zheng R, Zhang S, et al. The incidences and mortalities of major cancer in China, 2009. Chin J Cancer 2013;32:106-12. [PubMed]

